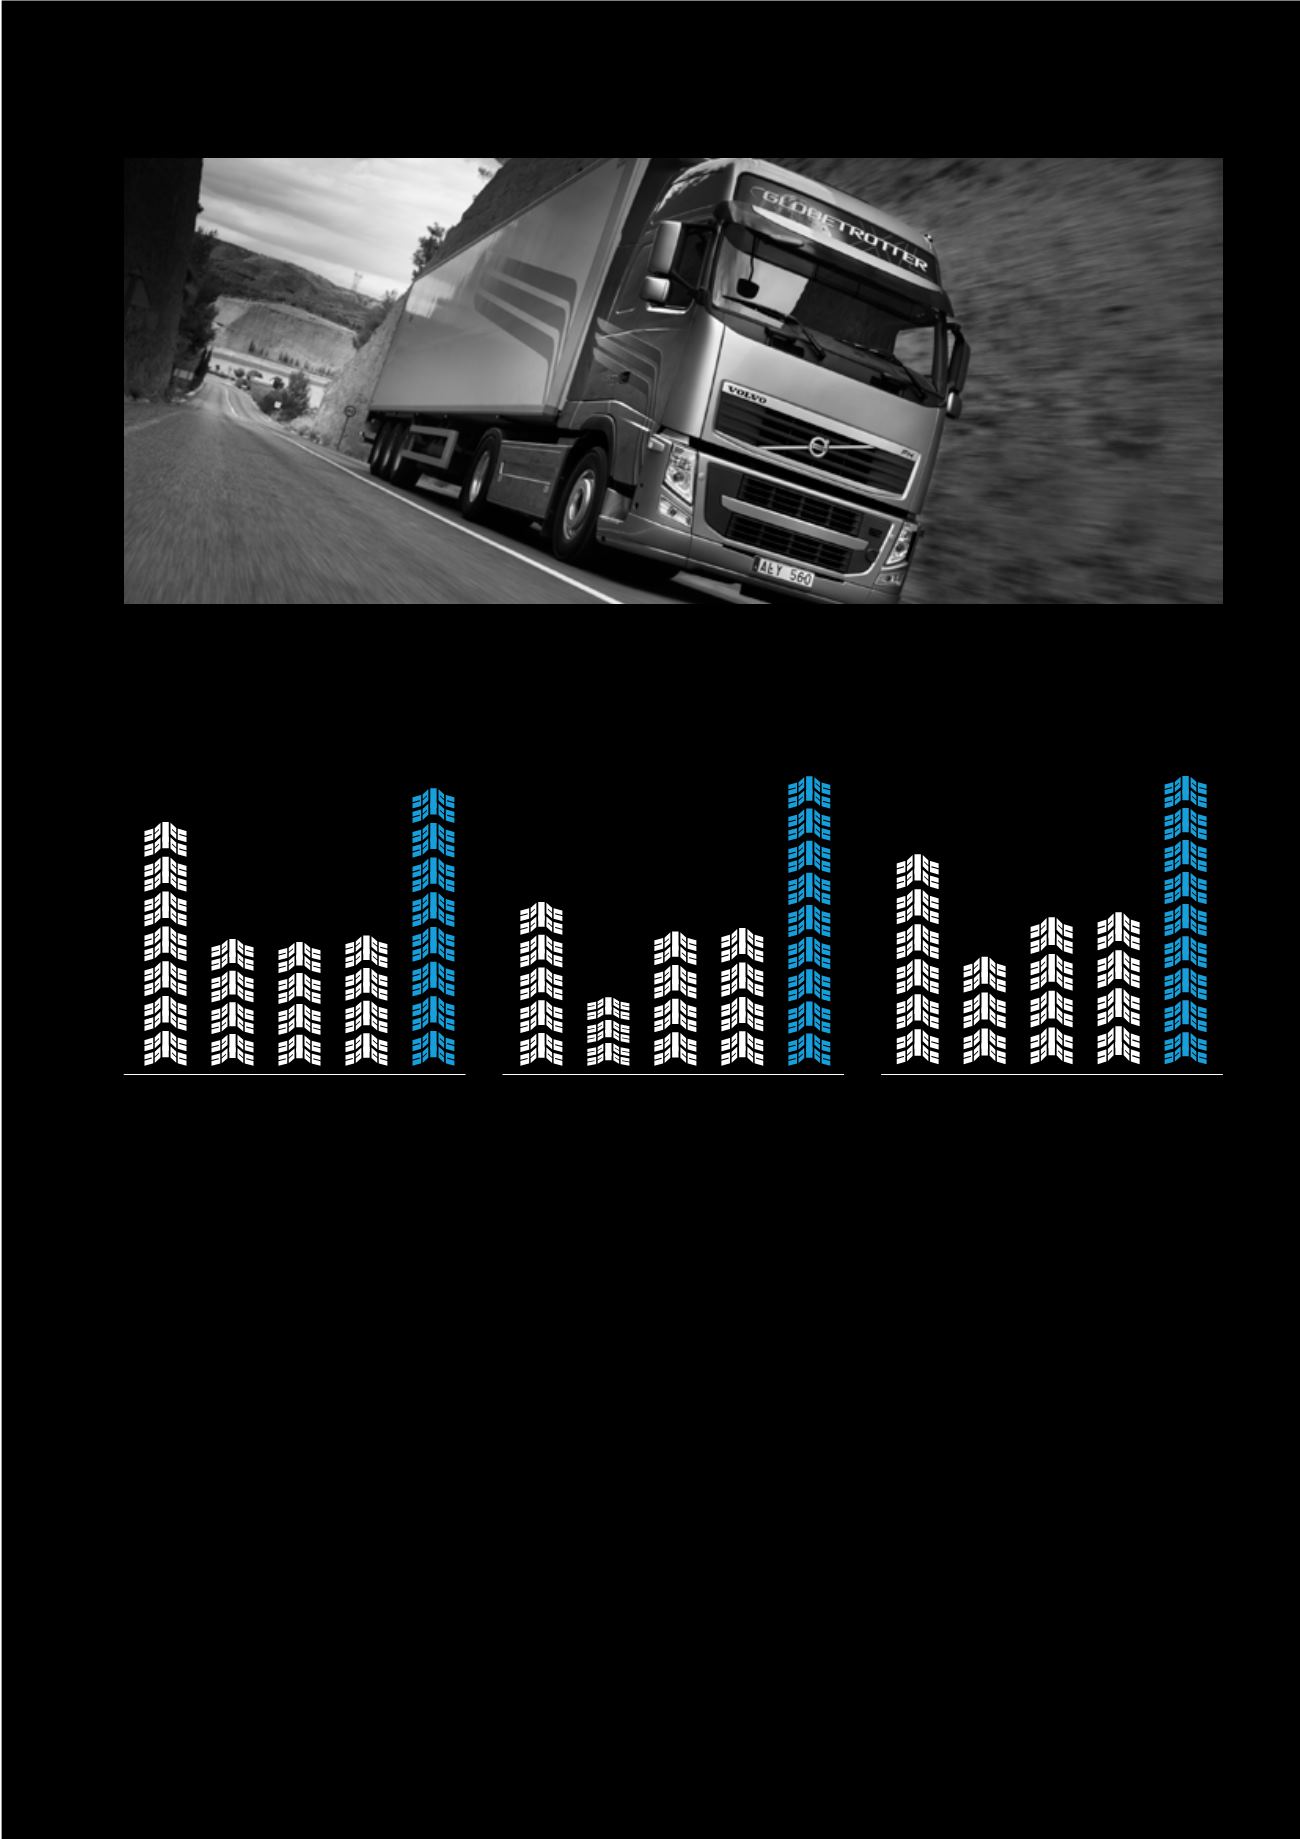

Truck Sales Volume by Year
(Vehicle Units)
Bus Sales Volume by Year
(Vehicle Units)
2010 2011 2012 2013
2014
2010 2011 2012 2013
2014
Gulf Cooperation Council (GCC)
aid packages and a stable political
environment. These factors had a
positive impact on the Commercial
Vehicles & Construction Equipment
line of business, which saw a surge
in both revenues and gross profits
in FY14. Management expects this
trend to continue into 2015.
• Gross profit margins for the line of
business, overall, posted an increase
year-on-year of 2.9 ppt in FY14, to
10.7%, and management remains
confident that current levels are
sustainable.
• In FY14, the Bus division registered
a more than two-fold increase in
sales volumes on the back of a pub-
lic stimulus and investments in fleet
renewal. The division continues to
expect a further lift when the rise in
spending on public transportation
projects begins to fully materialize.
• Exports through GB Polo tomarkets
in East Africa and the GCC began in
earnest in 2014, and the company
has done well in terms of market ac-
ceptance and repeat orders. The di-
vision also began delivering 300 city
buses in the fourth quarter of 2014,
with the final batch of the order de-
livered in 1Q15.
• Heavy, medium and light trucks all
performed well in FY14, attribut-
able to the improved market condi-
tions and uptick in infrastructure
spending, with the Trucks division
reporting sales in FY14 of more than
double the previous year.
482
542
470
1,063
495
1,090
1,055
2,292
927
1,297
CV&CE Total Revenues by Year
(LE million)
2010 2011 2012 2013
2014
465.8 481.0
912.9
340.5
665.4
Ghabbour Auto | 2014 ANNUAL REPORT
23


